
Shell Data Management
Service operation discovery and research assessments, integrating operative insights with system capabilities for enhanced field performance.
Client
Shell Global Plc
Year
2023
Industry
Oil & Gas
Type of Work
UX Research
Usability Testing
Shell is committed to build new visualisation and exploration techniques, that will offer geoscientists unprecedented access to knowledge stored in vast amounts of data.
This project focused on developing and enhancing a Sub-surface Data Management product for Shell, supporting the workflows of the Sub-Surface & Wells teams within the oil and gas industry.
The initiative involved conducting usability research alongside open ended questions to understand the needs, pain points, and expectations of end-users. Insights from these activities informed the design and optimization of the product following its migration from the Nintex platform to the Pega platform, ensuring seamless functionality, improved user experience, and alignment with operational requirements.
Engagement Highlights
Services, Deliverables, Results
What
-
Business Process Optimisation
-
Platform Migration
-
Agile Collaboration
-
Usability Testing
How
-
Discovery & Validation
-
Journey & Process Mapping
-
Stakeholder Workshops
-
Rapid Testing & Validation
-
Continuous Improvement & Sprint Planning
Outcome
The project delivered a benchmarking score (out of 10) across three key areas: general usability, user satisfaction, and ease of process transition for each functionality. A detailed list of issues and a summary of key pain points were shared with the product team to guide improvements.
Collaboration
Product Owner, Implementation Lead,
UI/UX Designer, Business Analysts, Development Leads, Geologists (Users)
From Unknown to foundations for Discovery
Why this Project
mattered
-
Helping upstream employees unleash the value of the subsurface by reinventing and optimising workflows, the integration and management of subsurface data, and the complex application platforms that enable exploration, drilling, and production workforces.
The Key
Problems
-
Subsurface data remains siloed, making integration and access a persistent challenge for energy companies.
-
Upstream operations face restricted access to critical information across the enterprise.
-
Complex application landscapes hinder seamless workflows across multidisciplinary and virtual teams, limiting outcome-driven performance.
The
Project aim
-
Establish a clear benchmark of the product’s current condition through objective.
-
Highlight current challenges and uncover opportunities to enhance the design.
-
Deliver preliminary suggestions to address identified issues and strengthen product performance.
-
Determine future priorities and define the actions required to fully unlock the product’s design potential and increase adoption
Basic Observations
Current platform exploration uncovered our first challenge to understand the information architecture, without it, it was extremely difficult to figure the workflows and key tasks of the users.
Upon analysis of the product, I found it still lacked many quality and accessibility issues, which needed immediate attention before it can be taken to the users. There was a little diversion from here, from our main objective, as I found the main architecture doesn't include any logic.

First Challenge
User Recruitment planning
3 steps
-
We sent out a questionnaire to identify about their domain knowledge.
-
Their role, experience in the upstream domain & main functionality they work on.
-
Their motivation to participate and give final consent.
-
1st User group - 10 most favorable were shortlisted based on their knowledge, experience & willing to participate in the exercise.
-
2nd User group - 3 Users were identified ( Technical Assurers )

Back to IA
Functionalities of the product are dependent of each other in their occurrence in real time. Presenting our test questions to the users need to be in order.
-
Both similarity matrix & affinity mapping gave the similar results of the information groups except of one group which was unaccounted for.
-
But there did emerge a pattern about how users look for information based on user verbatim.
Observation
Users follow a particular order when looking for information to complete their tasks, revealing how their mental model is structured.


Key Outcome
How users search for information !

Research Design
4 User Types
All the participants were identified after careful consideration by the team. They were Business Opportunity Managers (BOMs), Front End Development Managers (FEDM) and Project managers (PM) who have been using Product 2.0 (Nintex Platform).
Since Product 3.0 was a Platform transition with functionalities remaining the same, users with varied experience as well as new users who know the fundamentals and had explored the tool fit into our objective.
-
Defining our methodology - outreach & screening criteria, channel used,
-
Defining moderation & post test questions.
-
Analysis criteria -Findability, Comfortability, Critical Level, Issue Found.

-
A total of 10 major tasks were identified with subtasks.
-
Segregated tasks respective to the user journeys.
-
Number of tasks were a subset of major functionalities.
-
Each task were recorded in the adjacent format.
-
Round 1 with the users group 1 and Round 2 with user group 2.
Second Challenge
Basic Observations
All the participants were identified after careful consideration by the team. They were Business Opportunity Managers (BOMs), Front End Development Managers (FEDM) and Project managers (PM) who have been using Product 2.0 (Nintex Platform).
Since Product 3.0 was a Platform transition with functionalities remaining the same, users with varied experience as well as new users who know the fundamentals and had explored the tool fit into our objective.
-
Defining our methodology - outreach & screening criteria, channel used,
-
Defining moderation & post test questions.
-
Analysis criteria -Findability, Comfortability, Critical Level, Issue Found.


4 User Types
All the participants were identified after careful consideration by the team. They were Business Opportunity Managers (BOMs), Front End Development Managers (FEDM) and Project managers (PM) who have been using Product 2.0 (Nintex Platform).
Since Product 3.0 was a Platform transition with functionalities remaining the same, users with varied experience as well as new users who know the fundamentals and had explored the tool fit into our objective.
-
Defining our methodology - outreach & screening criteria, channel used,
-
Defining moderation & post test questions.
-
Analysis criteria -Findability, Comfortability, Critical Level, Issue Found.
-
A total of 10 major tasks were identified with subtasks.
-
Segregated tasks respective to the user journeys.
-
Number of tasks were a subset of major functionalities.
-
Each task were recorded in the adjacent format.
-
Round 1 with the users group 1 and Round 2 with user group 2.
Research Findings
Round 1
-
As explained earlier Round 1 was repeated after conducting with three users to adjust some initial roadblocks. Users are facing issues identifying various business functionalities with their represented nomenclatures. They are strongly functioning with their older habits.
-
Navigation back and forth, findability of different work spaces & switching between different stages, were prominent bad experiences recorded from this research.
Round 2
-
Major issue here is the business process to approve each discipline by TAs and then final by TA. This method created a long buffer time for TAs to wait for all disciplines to be completed. It's even lengthy process because approval getting rejected will renew the task again.
The report presents findings from usability testing of ten core tasks and their associated subtasks across distinct user journeys.
Each task’s performance was documented in a structured format.
The resulting analysis highlights key pain points and improvement opportunities under each of the ten functional categories.

Broader Categories to bring Ownership among different teams


The interviews led to actionable insights that informed immediate enhancements within the continuous improvement process, addressing quick wins while laying the groundwork for tackling more complex challenges.


Outcome
Benchmarking Score
The project outcome was a score out of 10 in primarily three categories, i.e. general usability, user satisfaction, and ease in process transition for each of the functionalities.
Focus Areas
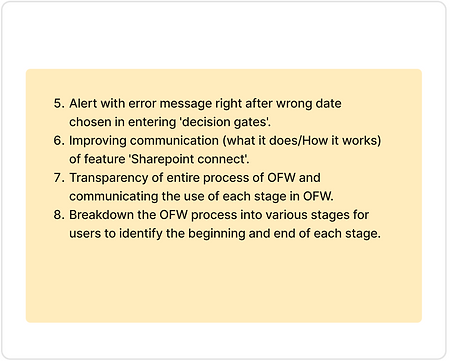
For each functionalities, a detailed list of issues pertaining was handed over to the product team, and a summarised version of key issues was also provided.
Continuous Improvement Roadmap
A roadmap and product strategy were developed to address key issues in both the short and long term. Selected research insights were also shared with product teams to help scale the initiative across a broader scope and to enable ongoing measurement of progress over time.
Impact on Business
-
The users enjoyed the activity and were very positive on contributing for the better development of the product.
-
We were able to uncover the first impressions of the user , and further work on the shortcomings.
-
It was very insightful for the Development team as the behavior's of the functionalities were different with respect to different approach and different users.
-
Uncovered area of improvements for the UI designing team to correct the issues experienced by the users.
-
Improved productivity by freeing them from data management activities and waiting times.
-
Successful realization and appreciation from the senior management by the outcome of research activity, and emphasis on continuing the practice more often for other projects as well.
Disclaimer : Some Parts have been blurred/hidden due to non-disclosure agreement.
Please contact to know more !
Next Project
Sleepword-Retail Platform